

By Peter Gleick and Matthew Heberger
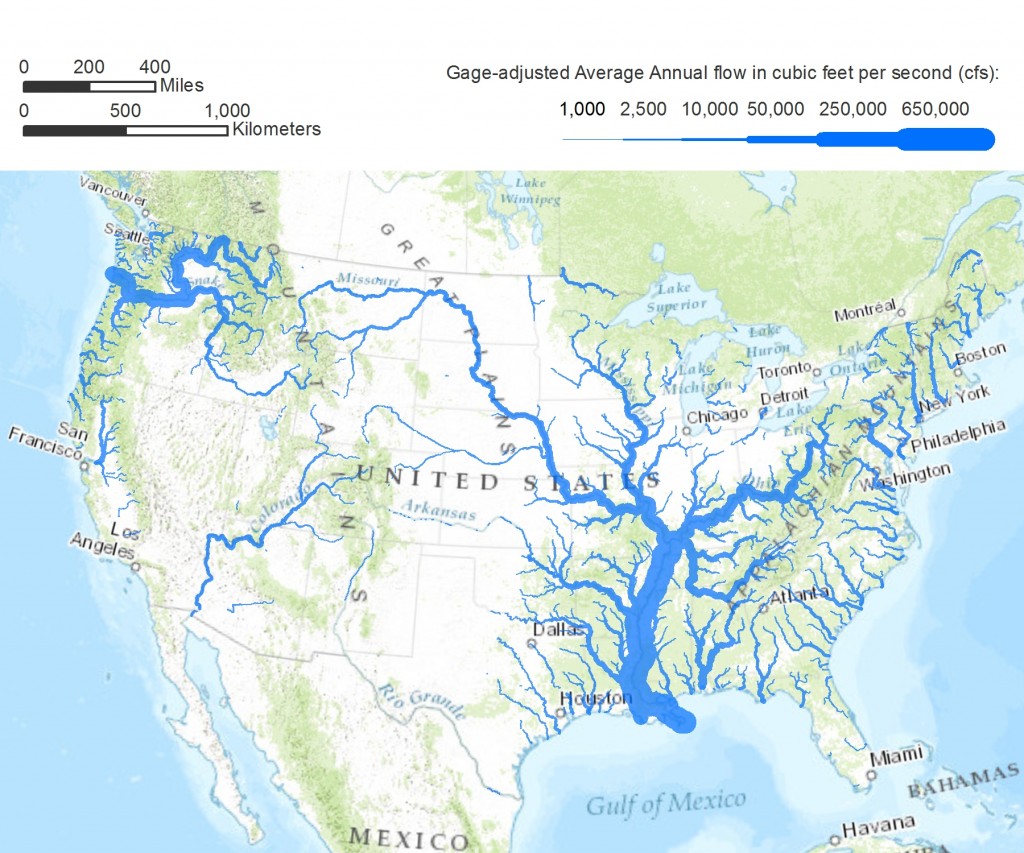
June 26, 2013 update: Several astute readers have pointed out that the western portion of our map looked a little, well, funny. It has been decades since some rivers had flows of the magnitude shown, due to dams and diversions. Indeed, our map shows modeled runoff, which represents unimpaired flows, and does not take these developments into account. Here is a new map, where river symbols are proportional to the “gage-adjusted flow,” which takes into account real-world observations. Note the thinning of the Colorado River as it makes its way south, due to withdrawals for cities and farms. Also note the drying of some of the West’s main rivers—long stretches of the Salt, Pecos, Canadian, Rio Grande, and San Joaquin Rivers virtually disappear as their flow drops below 1,000 cfs as a result of withdrawals for human use.
How much water is there in America’s rivers, and where is it? Perhaps unsurprisingly, people have little sense of how their local water resources compare in size to other water resources. “Is that a big river? A little river?”
One of us, Peter Gleick, grew up along the Hudson River on the East Coast, and encountered rivers that seemed to be about the same size: the Susquehanna, the Delaware, the Potomac. Anyone living in the West working on water issues becomes more familiar with the Colorado, the Sacramento, the San Joaquin, and the Rio Grande rivers, but still may have little sense of how much water flows through these different river systems on any given year.
Now it is possible to visualize the nation’s water resources in different ways. At the Pacific Institute we have used a new dataset to create a scaled map of the major rivers of the contiguous 48 United States. We’re accustomed to seeing maps with what cartographers call proportional symbols: big cites get bigger dots than small ones, and interstate highways have a heavier line than county roads. In this map, rivers are scaled according to volume of water they convey. (Specifically, the width of a river segment on the map is proportional to the square root of its estimated average annual flow volume.)
Several things stand out: the massive flow of the mighty Mississippi and Columbia River systems; the paucity of major rivers in the western US, especially the southwestern US, where the only major rivers are the seriously over-tapped Colorado and Rio Grande Rivers; and the local importance of the Sacramento-San Joaquin Rivers in California, which serve the state’s cities and agricultural regions.
The data for this map come from the National Hydrography Dataset (NHDPlus v2) developed and managed by the US EPA and US Geological Survey, made available to the public and water resources community. And while we share many rivers with our neighbors, this dataset, unfortunately, stops abruptly at the Canadian and Mexican borders.
Another extraordinary map created using the same dataset was recently published by Nelson Minar, a Google software engineer. His maps show every river and stream channel identified by the National Hydrography Dataset project, including intermittent and ephemeral rivers that run dry for part or most of the year. The map is a delight to behold, but many of the blue lines represent mostly dry channels. “And you thought the U.S. had deserts!” quipped Popular Science.
Now if only you could see the Amazon, whose flow is more than ten times greater than the Mississippi. That would be more than a line on a map.
* This work is licensed under a Creative Commons Attribution-NonCommercial-ShareAlike 3.0 Unported License.
Related:
Corporate Water Stewardship in the Colorado River Basin
Pathways and Barriers to Corporate Water Stewardship in the Colorado River Basin