
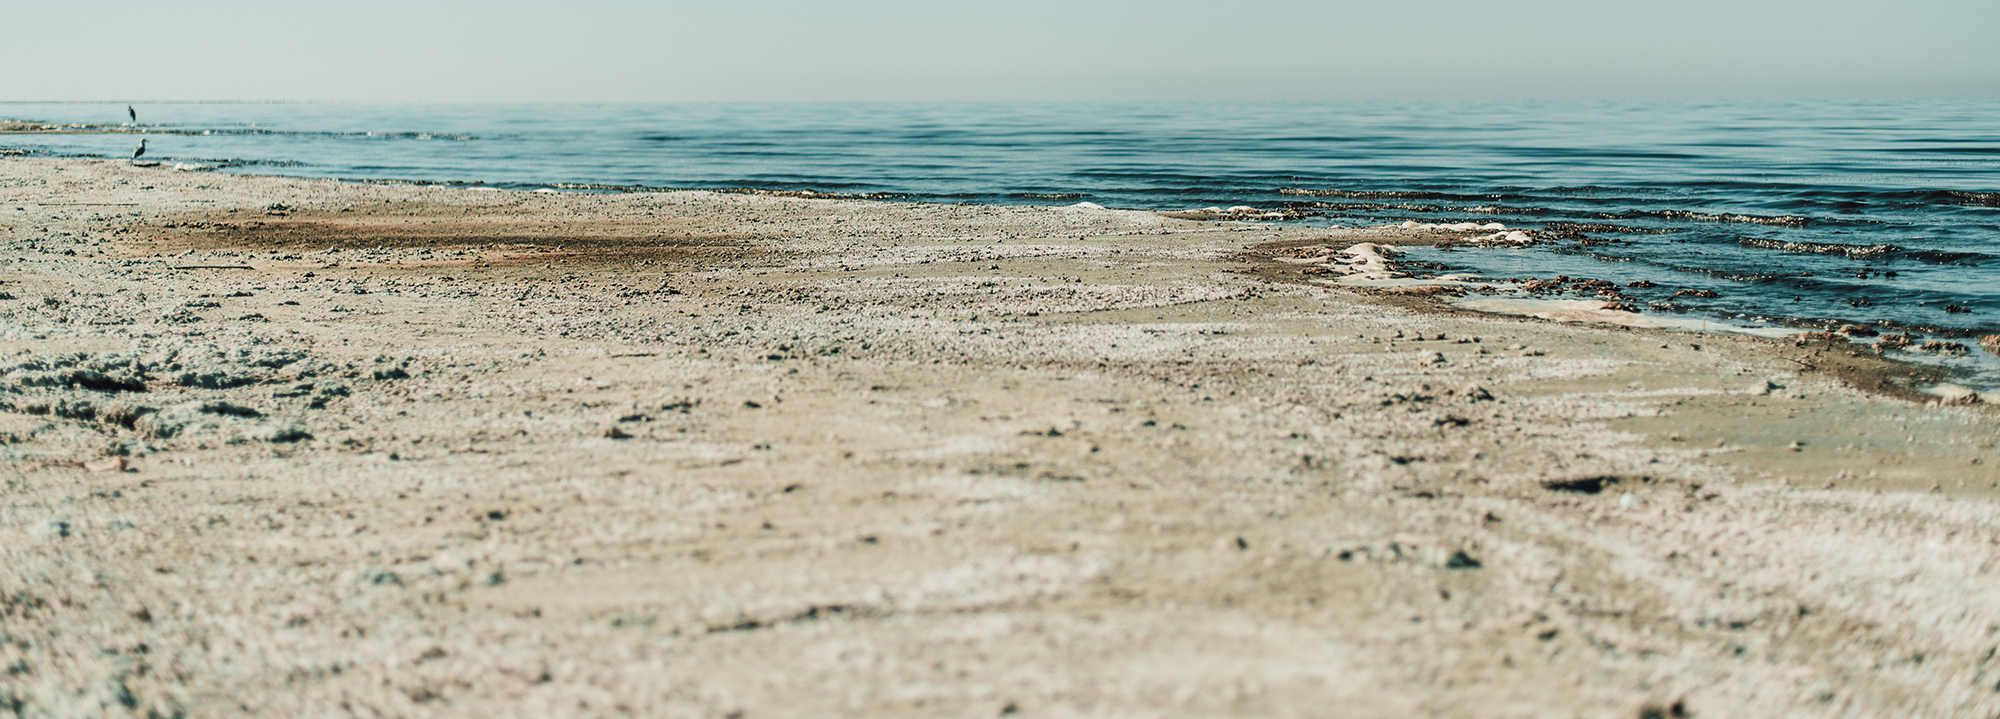
California’s Salton Sea is a fertile oasis in the hostile desert of southeastern California, adopted by millions of birds migrating along the Pacific Flyway. As California’s largest lake, it stretches across almost 35 miles in a remote, below sea-level valley in the southeastern corner of the state. Current Salton Sea information is posted below.
The Sea faces a host of challenges, including a declining water supply, rising salinity, very high levels of nutrients that generate excessive algal growth and very low oxygen levels, and, to date, a glaring disconnect between the rate of change and the rate of efforts to address that change.
Due to the continued decline of the Salton Sea, the USGS Salton Sea gage is no longer operational. A new gage will be installed in the coming months.
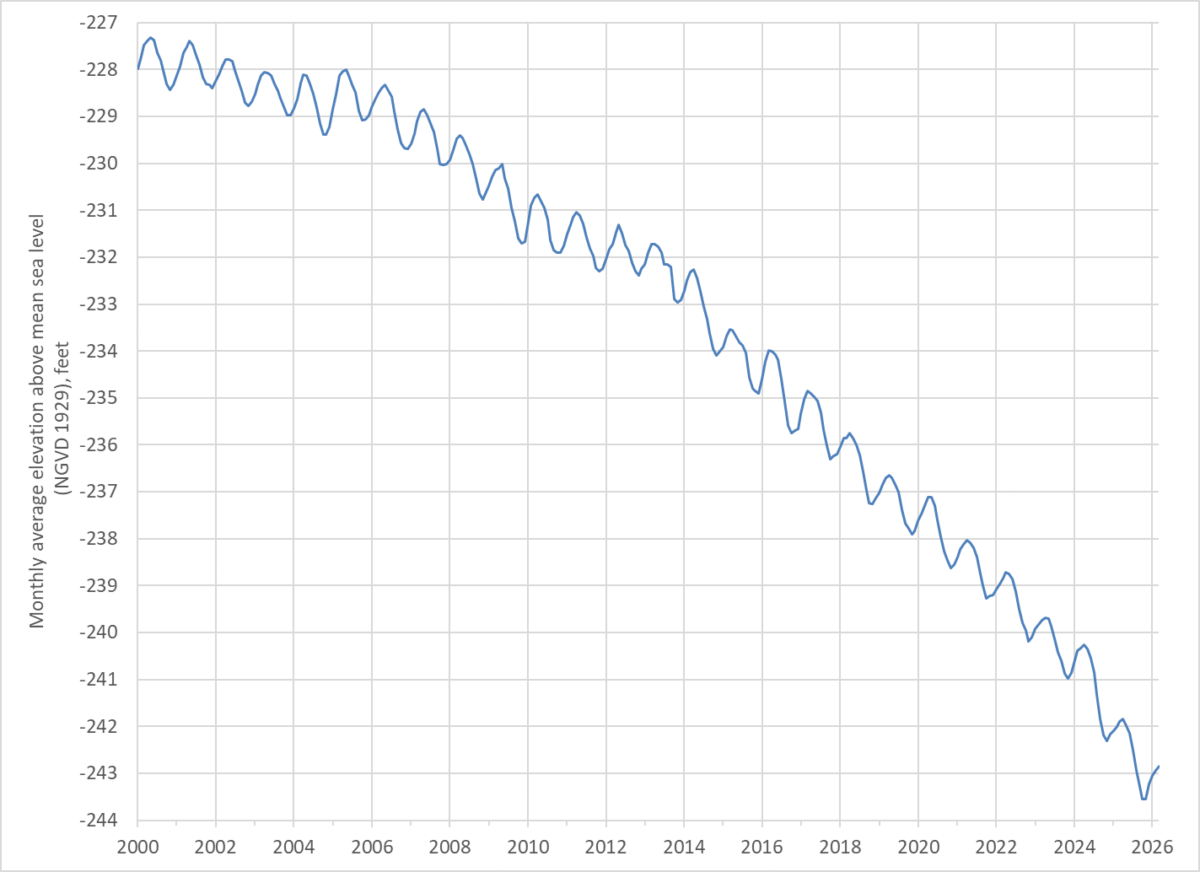
Salton Sea elevation, 25-July-2026 (last day of gage operation): -243.8 feet, NGVD 1929:Provisional data, subject to revision.
Source: USGS 10254005 Salton Sea NR Westmorland, CA
Time Series: Current/Historical Observations
Equivalent to: -241.7 feet, NAVD 1988
Area: acres ( sq miles)
Source: SALSA2 model
Volume: million acre-feet
Salton Sea elevation on 25-July-2003 Baseline: feet, NGVD 1929
Change from 2003 elevation: feet
Reduction in Salton Sea area: acres
( sq miles)
Currently shrinking by about 2,400 acres (3.75 sq miles) each year.
Water Inflow to the Salton Sea by Year, in thousands of acre-feet:
| Year | Imperial Valley | Mexico | Coachella Valley | Local Watershed | Ground water | sub-total | Project & Wetland use | TOTAL |
|---|---|---|---|---|---|---|---|---|
| 2016 | 983 | 70 | 80 | 4.4 | 11.5 | 1,149 | 1,149 | |
| 2017 | 942 | 69 | 77 | 4.7 | 11.8 | 1,104 | 1,104 | |
| 2018 | 913 | 61 | 75 | 4.7 | 12.2 | 1,065 | -33.9 | 1,031 |
| 2019 | 883 | 64 | 80 | 5 | 12.3 | 1,044 | -39 | 1,005 |
| 2020 | 892 | 63 | 82 | 4.9 | 12.3 | 1,054 | -44.1 | 1,010 |
| 2021 | 934 | 62 | 81 | 4.7 | 12.3 | 1,094 | -49.2 | 1,045 |
| 2022 | 911 | 62 | 74 | 4.4 | 12.3 | 1,065 | -54.3 | 1,011 |
| 2023 | 839 | 53 | 78 | 4.7 | 12.3 | 987 | -59.4 | 928 |
| 2024 | 776 | 46 | 70 | 4.5 | 12.3 | 906 | -70.1 | 836 |
| 2025 | 759 | 43 | 71 | 4.9 | 12.3 | 890 | -85.6 | 804 |
IID dust control projects: acres
Source: https://www.qsajpa.org/
SSMP dust control projects: acres Habitat projects: acres Open water atop playa: acres Revegetation atop playa: acres Net exposed playa: ~ acres ( sq miles)
Source: March 2026 SSP annual report, Table 3, p. 53
Source: March 2026 SSP annual report, Table 3, p. 53
Source: Formation, End-of-Year 2024 Playa Exposure Estimate
Source: Formation, End-of-Year 2024 Playa Exposure Estimate
Changes in bird populations: fewer pelicans, fewer eared grebes, more ducks and shorebirds
Salton Sea links:
- Salton Sea Library
- USGS – Water Availability of the Salton Sea Watershed
- Salton Sea Summit: Includes presentations and videos from the October 18-19, 2024, April 6-7, 2022 and October 17-18, 2019 conferences co-convened by the Pacific Institute.
- General Salton Sea Information from the Pacific Institute
- Salton Sea Air Quality Mitigation: IID
- California’s Salton Sea Management Program
- California’s Salton Sea Project Tracker
- New – Salton Sea Hub Site
- California’s draft Phase I: 10-Year Planof the Salton Sea Management Program
- November 7, 2017: California’s State Water Board Adopts ORDER WR 2017-0134 on Long-Term Management of Salton Sea
- Audubon’s webpage on the Salton Sea
- Audubon’s interactive Salton Sea map
- Salton Sea Partnership
- General Salton Sea Information from the U.S. Bureau of Reclamation
- Salton Sea Science Office of the U.S. Geological Survey
- Community Science: Salton Sea Environmental Time Series
- Salton Sea Validation – JPA
- Salton Sea Authority website
- General Salton Sea and Vicinity Land Ownership and Management Map
- Birds Observed at the Salton Seafrom the Cornell Lab of Ornithology
- Salton Sea Timeline from USA Today: “Salton Sea: A History of Broken Promises”