By Darcy Bostic, Walker Grimshaw, and Michael Cohen
Access to safe drinking water is necessary, especially during a pandemic
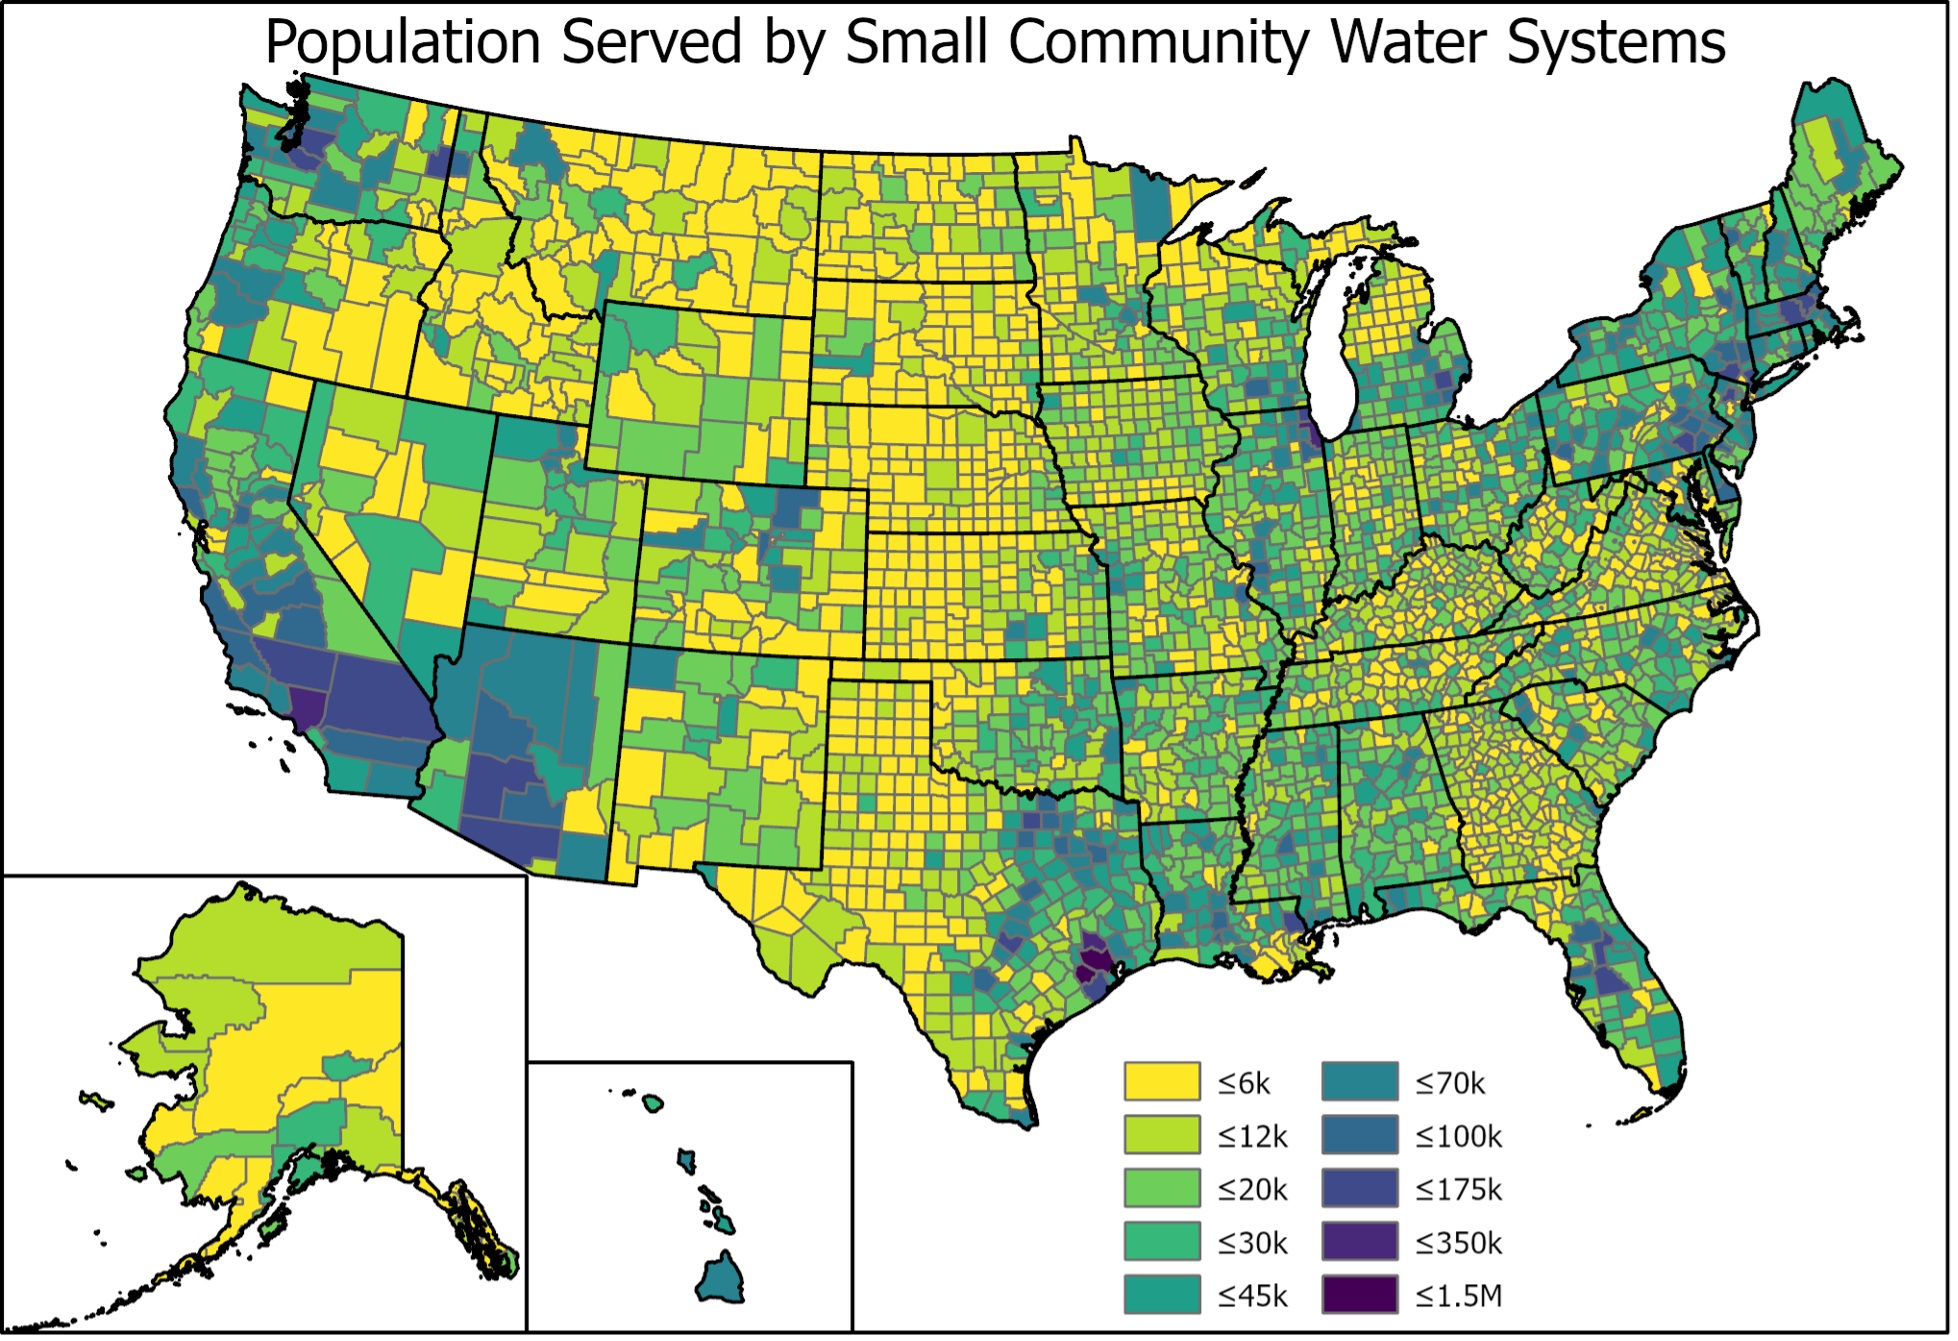
In the U.S., the vital responsibility of continuing safe water supply during the pandemic is decentralized, spread among nearly 50,000 community water systems. More than 45,000 of these are small community water systems (SCWS), serving fewer than 10,000 people each. Together, SCWS provide water to more than 53 million people — 18 percent of the national population — across urban and rural areas, on tribal reservations, in the midst of larger utilities in huge metropolises, and in growing communities.

Before the pandemic, small systems already faced barriers accessing financing for maintenance and capital projects. The pandemic has exacerbated pre-existing challenges for SCWS and poorer communities faced with rapidly rising water bills, financial and cyber insecurity, and the rising costs of treating new contaminants in their water and wastewater. SCWS have lost revenue and seen expense increases. Their customers have accumulated millions in water-related debt while state funding has fallen. While most systems have remained resilient and kept the water running to their customers, the revenue losses have caused delays or cancellations to capital projects and routine maintenance that may impact their ability to supply safe, affordable water into the future.
Despite the critical role of small systems, and that they are frequently overlooked in state and federal stimulus and aid packages, only a few surveys across the country have attempted to understand the scope of small system financial loss and customer debt due to the pandemic (Table 1). A new report from the Pacific Institute summarizes these surveys and provides information on revenue losses experienced by SCWS in the U.S. and debt accumulated by their customers due to the COVID-19 crisis. The report also includes a set of case studies illustrating the challenges SCWS face due to COVID-19 and presents recommendations for providing better support for small systems as they recover from the pandemic.
Analysis of national and California surveys shows the impact of the pandemic on SCWS, including declines in revenues and expenses, staffing, financial reserves, and affordability and increasing debt among their customers
While most systems have experienced only small changes in expenses and revenues from the pandemic, between one quarter and one half of systems have lost revenue during the pandemic, some losing more than 30 percent of their revenue. Extrapolating the limited responses from national surveys by the Rural Community Assistance Partnership in May 2020 and the US Environmental Protection Agency in October 2020 suggests nationwide revenue losses are greater than average losses reported in California alone and could total $1.5 billion for SCWS nationally in 2020.
This revenue loss has resulted in large numbers of SCWS struggling to cover their operating expenses. Between 10 and 20 percent of SCWS that responded to the surveys reported the ability to meet expenses for less than six months without financial assistance. We did not however find reports of system failures or bankruptcies. Instead, even more systems have reported delaying maintenance, capital projects, and rate increases or operating a deficit to continue their operations. These mitigating actions have kept the water flowing to millions of customers, but deferring maintenance to already aging infrastructure could compromise the ability of water systems to supply safe water in the short- and long-term or result in expensive water main breaks.
Rising affordability challenges have combined with the pandemic to create a water-debt crisis
In February 2021, 40 percent of Californian households reported that paying for typical household expenses was somewhat or very difficult — up from 32 percent in October 2020. This is reflected in challenges customers face paying for utilities. Although most customers are still able to pay their water bills on time, almost 10 percent of California SCWS customers owe an average of $370 to their utility — accumulating as much as $38 million of water–related debt.
Residents of larger water systems are also struggling. Deborah Bell-Holt, a customer with the Los Angeles Department of Water and Power, told Jackie Botts of CalMatters that she is nearly $15,000 behind on her water and energy bill. She supports 12 people in her house, many who have lost jobs during the pandemic. “They say you’re safe,” she told CalMatters. “But you see that bill. How is that supposed to make you feel? You’re scared to death.”
Nationally, about 35 percent of adults live in households where it has been difficult to pay for usual household expenses during the pandemic. Extrapolating from the California survey suggests that total national water household debt for SCWS customers may have been on the order of $800 million as of November 2020. These surveys also show that communities of color and communities with high rates of poverty have the most water debt, and thus are disproportionately impacted by the pandemic itself, as well as the economic challenges associated with paying for water.
The data provided through various surveys show that there is a significant need for federal and state assistance to ensure that SCWS, and their customers, can continue to operate and live healthy and safe lives
Without federal assistance, many SCWS, and their customers, may be at risk. To address the needs identified in the surveys, we recommend targeting federal relief to both utilities and customers.
Utility focused aid should include direct funding and financing for infrastructure projects that ensure each system has the necessary resources to maintain safe and affordable water, wastewater, and waste disposal service. This should include:
- Enacting the Emergency Assistance for Rural Water Systems Act through the USDA
- State Revolving Funds (including grants and zero interest loans to local governments),
- sewer overflow control grants,
- water workforce development grants, and
- grants for lead treatment, remediation and replacement.
Customer–focused aid should increase funding assistance for low-income water and wastewater customers, recognizing that customer aid also aids utilities. Congress appropriated $1.14 billion in assistance for low-income water and wastewater customers through two pandemic relief legislation bills, but it has yet to be allocated to states. Specific attention should be given to SCWS and their customers to ensure they are included in current and future federal aid disbursements.
In the long term, assistance bringing down the cost of water is needed. “We need affordable water rates based on residents’ ability to pay their water bills…Federal water assistance is welcome, but it is not an affordability program and doesn’t address the underlying problem of unaffordable water rates,” says People’s Water Board Coalition organizer Sylvia Orduno.
There is broad support for a federal customer assistance program and additional funding for technical assistance and capital improvements for SCWS. Together, these programs can ensure that utilities continue to provide safe water and customers maintain affordable access it, during a pandemic and beyond.
Table 1. State and national surveys on the financial and operational impacts of COVID-19 on water systems.
|
Survey Organization |
Geographic Area |
Sample Size (Small Systems, Large Systems) |
Survey Dates |
Key Attributes |
|
Rural Community Assistance Partnership (RCAP) |
National |
1,033 (991, 42) |
May 2020 |
Surveyed Systems RCAP worked with in 2019 Data includes revenue changes, primary COVID-related challenges, duration of ability to operate, average population served Raw data available |
|
National Rural Water Association |
National |
4,636 (4,311, 325) |
April 2020 |
Change in water use and revenue, COVID-related concerns Raw data not available |
|
California State Water Resources Control Board (CA SWRCB) |
California |
213 (123, 90) |
June-August 2020 |
Voluntary survey that may not be representative of whole state Revenue loss as % of revenue and cash reserves Raw data available |
|
CA SWRCB |
California |
536 (276, 260) |
November 2020 |
Statistically representative sample of the state with outreach to assist small systems Month-by-month revenue and expenses, cash reserves Raw data available |
|
Illinois Section AWWA |
Illinois |
141 |
April 2020 |
Operational and financial impacts to systems, but no quantitative financial data Raw data available |
|
Illinois Section AWWA |
Illinois |
73 |
June 2020 |
Raw data available |
|
Washington State Department of Health |
Washington State |
314 (216, 98) |
May-July 2020 |
Results not divided by system size Predicted impact on statewide capital projects Raw data not available |
|
American Water Works Association (AWWA), Association of Metropolitan Water Agencies, Raftelis |
National |
532 |
March 2020 |
Combination of Raftelis survey on large systems and AWWA to estimate financial and economic impacts Raw data not available |
|
AWWA |
National |
421 (187, 234) |
June 2020 |
High levels of revenue and cash-flow issues Raw data not available |
|
Environmental Finance Center at UNC |
North Carolina |
95 (49, 46) |
April-May 2020 |
Revenue change, impacts on capital projects and rates Raw data not available |
|
Raftelis-Nicholas Institute |
National |
10 (All Large) |
March-August 2020 |
Not a survey, but instead used high resolution water use and billing data Raw data not available |
|
Raftelis |
National |
69 (All Large) |
August-September 2020 |
Revenues compared to budgets rather than previous year’s revenue Customer Assistance Program and Payment Plan Enrollment Raw data not available |
|
State of California Public Utilities Commission |
California Investor-Owned Utilities |
8 (All Large) |
January-September 2020 |
Arrears and rate assistance enrollment data for California’s largest private utilities Raw data available |


