
California Urban Water Suppliers Water Use Map
California Urban Water Suppliers Water Use Map
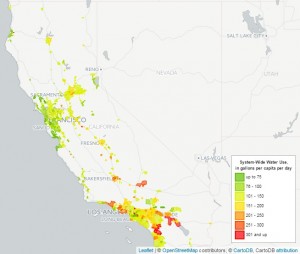
A web app from the Pacific Institute shows how different California cities are responding to California’s water situation. This web feature brings to life newly-released data on residential and system-wide water use, and allows users to explore trends and patterns in that use. Since July of 2014, the State Water Resources Control Board has required urban water utilities with more than 3,000 customers to report their water use each month. These new data show total system-wide water use, as well as residential water use, i.e., the estimated portion used by residents in and around their homes. Per-person water use is reported in units of gpcd, or gallons per capita per day. The Pacific Institute has created an interactive online map and table to help readers decode this wealth of new information on water use in California. These web features allow readers to examine how water use varies within regions, across the state, and over time. Colored zones of our online map show a gradient of water use across the state, from green for lower per capita water use to bright red for the highest users. Additionally, graphs show how per capita use varies over time and how it compares to the regional and state averages. The Pacific Institute has also developed an interactive table—providing a more detailed view of the data. You can easily filter and sort the data, inviting you to pose your own questions. For example, why is water use higher or lower in some areas? How have cities responded to Governor Jerry Brown’s call to reduce their water use by 20 percent? Have high water users had more success at conservation than areas where water use was already low? Many factors affect per capita water use, and cross-city comparisons have some limitations. Water use can depend on the level and type of industry, income, climate, and mix of single-family and multi-family homes. Thus, a city with a high degree of water-intensive industrial or commercial development would tend to have a higher per capita demand than a mostly residential city. Comparing residential use removes some of these factors, but all else being equal, a city in a hot, dry climate would likely have a higher outdoor water use than a city in a cool, wet climate. While cross-city comparisons are imperfect, they can offer valuable information and insight on how and why water use varies across the state. We will continue to update this map as the State Water Board releases new data. Each addition to the dataset offers new information about water use in California. For example, in many areas, water use drops off dramatically when winter arrives and there is less need for landscape irrigation, while in others, water use remains steady.
Overview
Resources