

By Matthew Heberger, Senior Research Associate
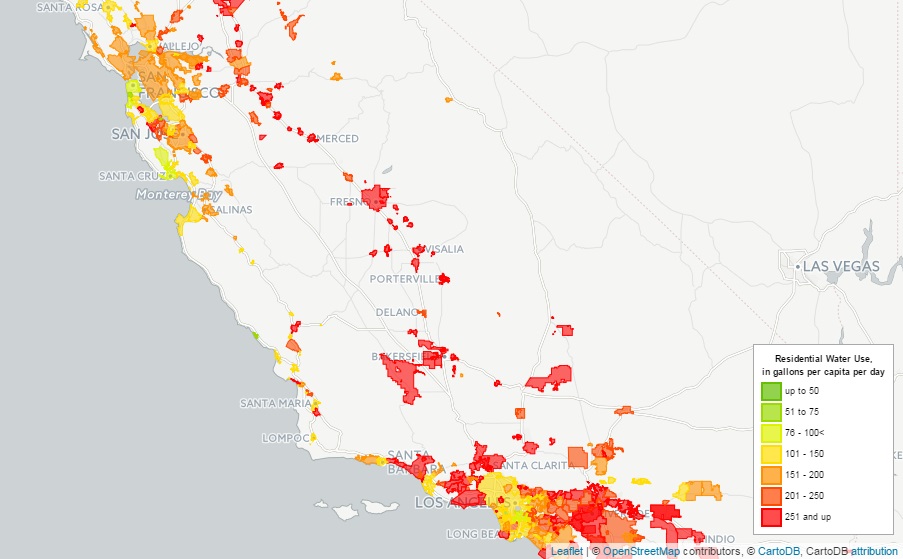
New monthly water use data for California water utilities shows that residential water use varies widely around the state, and that the response to the drought has been uneven. Moreover, in some areas, residential use averages more than 500 gallons per person per day, indicating that we could be doing much more to save water.
In July, the State Water Resources Control Board, or the Water Board, issued an emergency regulation to increase water conservation in urban areas. The new regulations prohibit certain water uses, like washing driveways and sidewalks, and imposed new restrictions on outdoor irrigation. Additionally, water utilities are now required to submit monthly reports on water use, including a comparison to how much water was used during the same month in 2013. Last week, the Water Board published the latest monthly water use reports for 397 urban water utilities. While a handful of utilities failed to report on time, those that did report cover about 99% of the state’s population.
Each water utility reports per-person water use in terms of gallons per-capita per day or “gpcd” and the portion used by residents in and around their homes. The result is a first of its-kind compilation of monthly water use data for urban water utilities in the state. And while officials cautioned that many factors affect water use, these data, displayed on the map below, reveal a number of interesting patterns and trends. Click on a utility’s service area to view a chart of residential water use, and how it compares to the same month last year, and to the average use for the state and its Hydrologic Region.
The Water Board collected information from all of the state’s “urban water suppliers” defined by state law (California Water Code Section 10617) as “a supplier, either publicly or privately owned, providing water for municipal purposes either directly or indirectly to more than 3,000 customers or supplying more than 3,000 acre-feet of water annually.”
We mapped water suppliers using information from the California Department of Public Health’s Drinking Water Systems Geographic Reporting Tool, supplemented by our own research. Where a water supplier serves a large, mostly rural area, we identified populated areas within the service area.
Perhaps the first thing you notice is the large range in reported water use. Residential water use in September 2014 ranged from a low of 45 gpcd in Santa Cruz to a high of 584 gpcd in areas served by the Santa Fe Irrigation District in San Diego County. Water use tends to be lower in the cooler coastal region, and in denser, urbanized areas. Likewise, water use tends to be higher in hotter, drier regions, and in suburban areas with more outdoor landscaping and lawns. The chart below highlights utilities with the five highest and lowest residential per capita water use rates in the state.
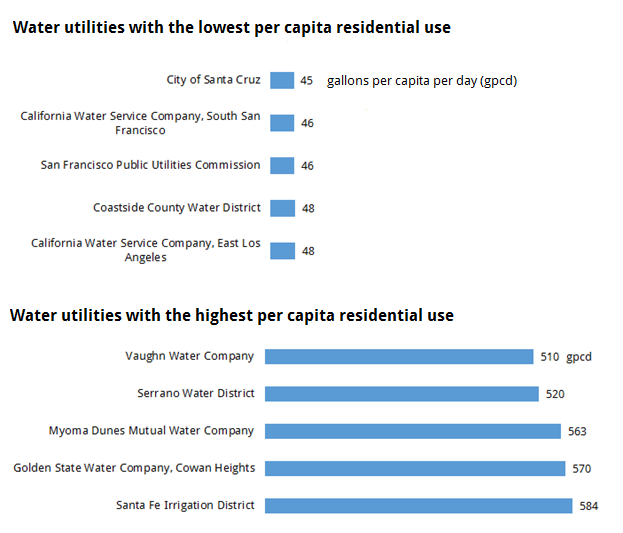
Highest and lowest residential per capita water use rates among California water utilities in September 2014
The data also show that conservation efforts have been extremely uneven around the state. In January, Governor Jerry Brown declared a state of emergency and called on Californians to reduce their water usage by 20 percent. To date, conservation efforts have fallen short of the governor’s target, despite the fact that a majority of Californians believe that there is a “serious water shortage.” Water use in September 2014 was down an average of 10% compared to the previous year. In fact, only 40 out of 397 water utilities reported water use reductions of 20% or more. Cities that saw the biggest cuts in water use include San Francisco Bay Area cities of Dublin, Livermore, Menlo Park, and Pleasanton, as well as Santa Cruz, Santa Maria, and Santa Barbara on the Central Coast. For a handful of water utilities, water use actually increased in the past year, despite the drought. Cities that saw water use creep up include East Palo Alto, Crescent City, Gilroy, Lodi, Newport Beach, and Sonoma.
And while Californians have made gains in using water more efficiently in the last few decades, these recent data shows that there is still plenty of room for improvement. Statewide, residential water use in September averaged 125 gpcd. A recent analysis by the Pacific Institute showed that an average Californian living in a home equipped with widely-available water-efficient appliances and fixtures would use about 32 gallons per day indoors. In addition, many Californians could reduce their outdoor water use by 70% or more by landscaping with low water-use plants. International experience demonstrates that such dramatic savings are possible. For example, Australian households use an average of 54 gpcd for both indoor and outdoor uses, and residents of the Australian state of Victoria use only 40 gpcd.
The Aussies weren’t always water misers, but decreased their water use dramatically in response to a decade of drought. Similar changes are underway in California, but should be accelerated. For example, turf removal or “cash for grass” programs are enjoying huge popularity around the state. Replacing lawns with California natives or Mediterranean plants has a host of benefits beyond water savings: colorful blooms that attract birds and pollinators; ease of maintenance; and less need for fertilizers and pesticides. Other efficiency improvements are also possible, such as finding and repairing leaks and upgrading toilets, clothes washers, faucets, and showerheads to water-efficient models with a WaterSense or Energy Star label.
We will continue to monitor the latest data from the Water Board to gage drought response around the state and look for interesting trends and new ways to visualize and understand these data. What do you notice when you look at these numbers?
Pacific Institute Insights is the staff blog of the Pacific Institute, one of the world’s leading nonprofit research groups on sustainable and equitable management of natural resources. For more about what we do, click here. The views and opinions expressed in these blogs are those of the authors and do not necessarily reflect an official policy or position of the Pacific Institute.