By Matthew Heberger, Senior Research Associate
As California heads into its fourth consecutive year of drought, and pronouncements about our water supply are increasingly dire, new data released by the state show that water use and water conservation efforts in cities across the state are highly uneven. Since June of 2014, the State Water Resources Control Board has required urban water suppliers to submit monthly reports of water use, in order to help track conservation efforts. As of now, the state has collected 8 months of data from about 400 water suppliers.
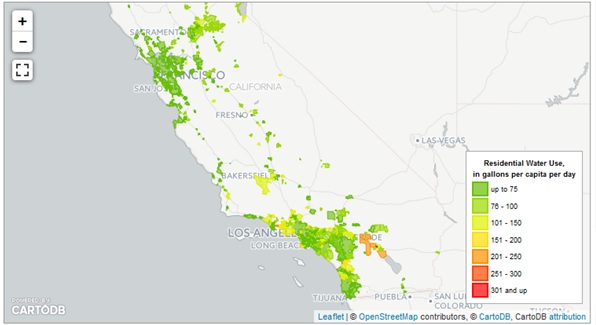
We have created a pair of online features to help readers explore and visualize urban water use in California: (1) a table where you can filter and sort water suppliers, and (2) a map that displays water use by water supplier. Here’s a tip: click on a water supplier’s area on the map to see charts of water use. Hover your mouse over the chart to see the data values.
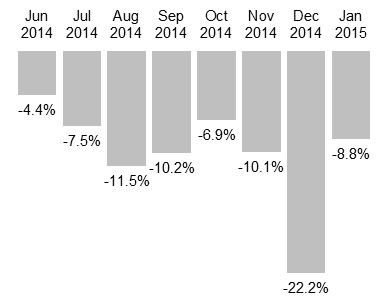
These data visualizations help reveal insight into patterns of water use around the state, and water suppliers success or failure at achieving water use reduction targets. Water use in California varies from month to month; in our Mediterranean climate, water use over time follows a familiar bell-shaped pattern, with highest usage in the summer months and lower use during the cooler, wetter winter months. In January 2015, water use was 8.8% lower than in January 2014. This was disappointing to water regulators, as urban areas had succeeded in reducing December use by 22.2% when comparing 2014 to 2013.
In fact, December was the only month where conservation met the voluntary 20% cutbacks that Governor Jerry Brown called for in an emergency drought declaration in early 2014. December was an anomalously wet month around the state, and it seems most of us watered our lawns and gardens less frequently as a result. However, January saw unusually warm and dry conditions return, driving water use back up, and water use reductions a disappointing 8.8%.
Indeed, looking back at the past 8 months, the state as a whole has fallen well short of the governor’s 20% conservation target. This is despite the fact that 95% of water suppliers have enacted some form of drought restrictions. And the fact that a recent public opinion poll found that 94% of Californians believe that “the state is undergoing a serious water shortage” (Field Poll Release #2501, February 26, 2015.)
Our data visualizations help show how variable urban water use is around the state. Water managers commonly report average water use in units of gallons per capita per day, or gpcd. When we look at per-capita water use around the state, the biggest users are in Southern California, which has the highest temperatures and the lowest rainfall.
Per-capita use also tends to be higher in wealthy communities. Houses with large lawns and pools are a major culprit. But research has also shown that households use more water for each additional bathroom, even when you hold the number of residents equal (see page 196 in this 2011 study). In Orange County, the high water use in the wealthy enclave of Cowan stands out on our map. Here, residents used 281 gallons per capita per day in January 2015. In nearby Santa Ana, where 20% of the population was below the poverty line in 2010, water use was a much lower 56 gpcd.
Around the state, in January 2015 there were 7 water suppliers where residents used more than 200 gallons every day, shown here:
| Water Supplier | Population Served | Residential Water Use in 2015, in gallons per capita per day |
Percent Change from January 2014 |
| Myoma Dunes Mutual Water Company | 6,159 | 342 | -8% |
| Golden State Water Company Cowan Heights | 5,390 | 281 | +5% |
| Coachella Valley Water District | 202,660 | 238 | -10% |
| Serrano Water District | 6,641 | 237 | -36% |
| Santa Fe Irrigation District | 19,386 | 231 | +3% |
| Camarillo, City of | 46,639 | 225 | -9% |
| Desert Water Agency | 62,142 | 201 | -11% |
One might ask whether it’s fair to call on everyone to cut water use by 20%. For water hogs, this should be easy. But what about areas where water use is already low? Some water suppliers have been running aggressive water conservation campaigns for decades. If nearly everyone is already using efficient appliances and fixtures and taking short showers, where will these additional savings come from? It’s like squeezing water from a stone, right? Maybe not. A handful of areas have made cuts to their already-low water use. For example, the LA-area community of Rancho Dominguez, served by the for-profit Park Water Company, saw double-digit declines, with water use dropping from 51 gpcd in January 2014 to 42 gpcd in January 2015. On the San Francisco Peninsula, the community of San Bruno saw similar declines, from 48 to 41 gpcd.
Pan and zoom around our water use map. What stands out to you? (Of course this map only tells part of the story. Urban areas account for about 20% of the state’s water use in an average year. The state does not have a comprehensive program to measure or track agricultural water use, so this is impossible to show farm water use for irrigation on our map.)
Pacific Institute Insights is the staff blog of the Pacific Institute, one of the world’s leading nonprofit research groups on sustainable and equitable management of natural resources. For more about what we do, click here. The views and opinions expressed in these blogs are those of the authors and do not necessarily reflect an official policy or position of the Pacific Institute.


