

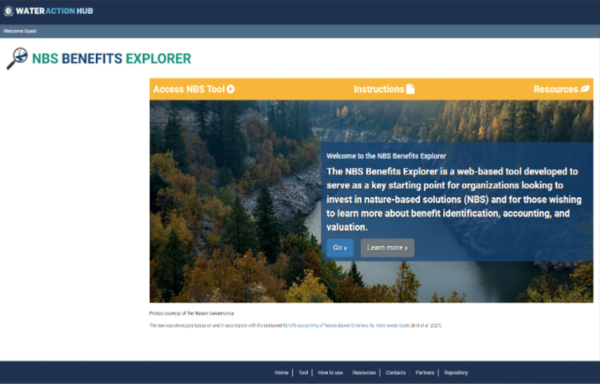
The NBS Benefits Explorer, part of the Water Action Hub (a suite of digital tools for corporate water stewardship), is designed to serve as a key starting point for organizations looking to invest in #NatureBasedSolutions (NBS).
In an ongoing effort to understand the connections between water resources, water systems, and international security and conflict, the Pacific Institute initiated a project in the late 1980s to track and categorize events related to water and conflict, which has been continuously updated since.
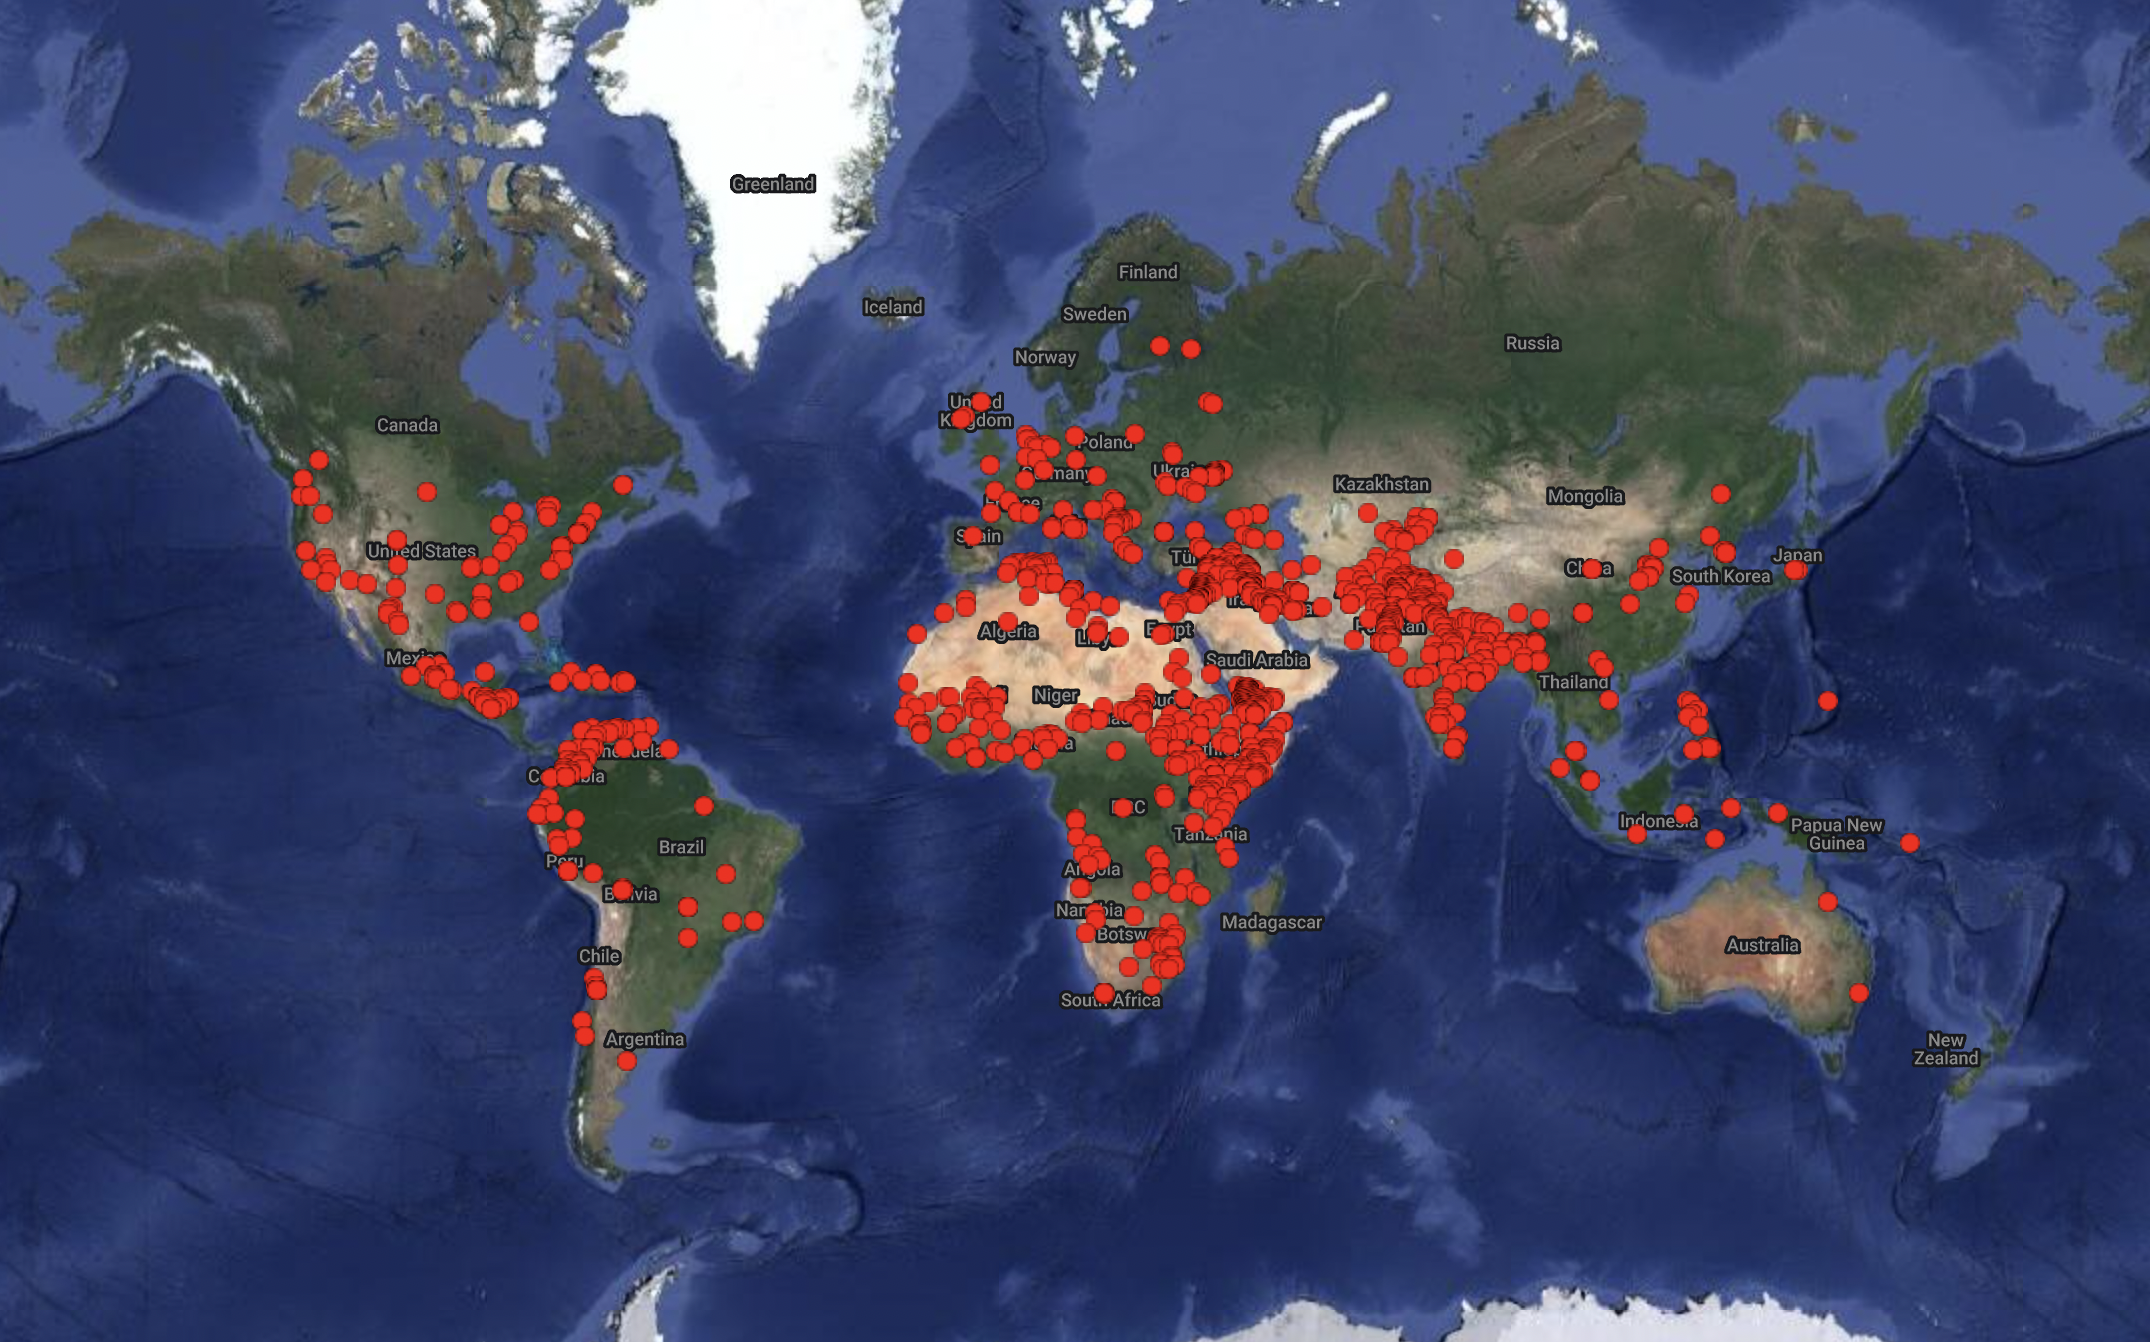
The Water Action Hub catalogs and facilitates water stewardship projects in river basins and regions around the world.
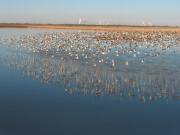
This page is the go-to resource for up-to-date information on the Salton Sea, California’s largest lake. The page displays the current size and elevation of the sea, the status of habitat and dust-control projects, changes in bird populations, and more.
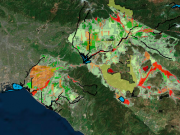
This map identifies, across California’s Santa Ana River Watershed, what areas have the greatest potential water benefits to be gained from installation of sustainable landscapes on commercial and industrial parcels. There are two key components of this interactive map: a watershed-scale assessment and an assessment of parcel-level water benefits.
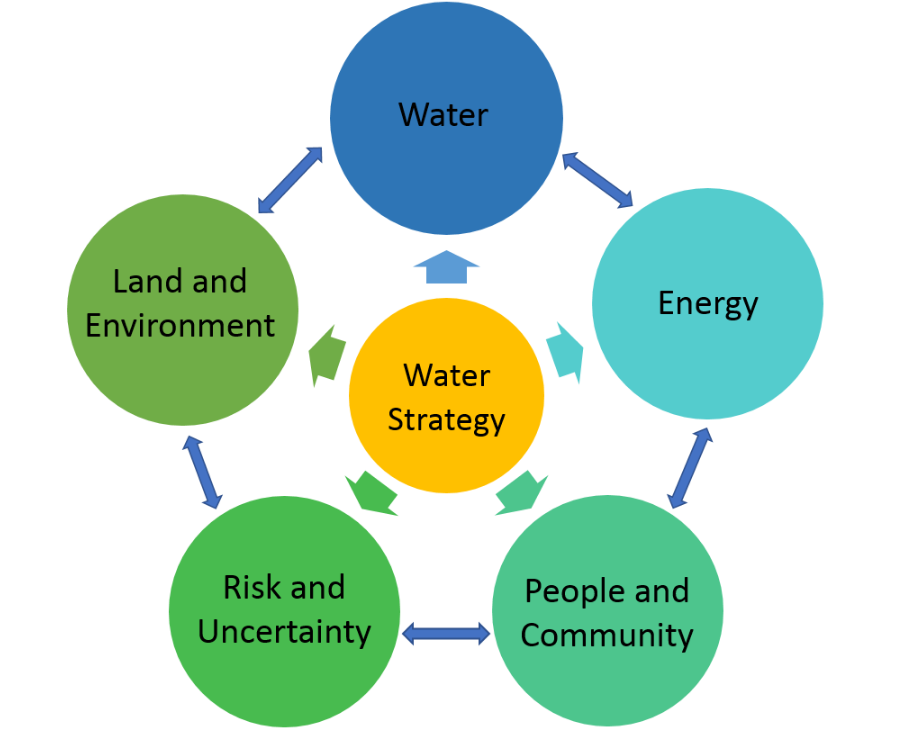
Here, we provide a resource library for analysts, decision makers, and advocates seeking to identify and examine multiple benefits of a broad range of water management strategies.
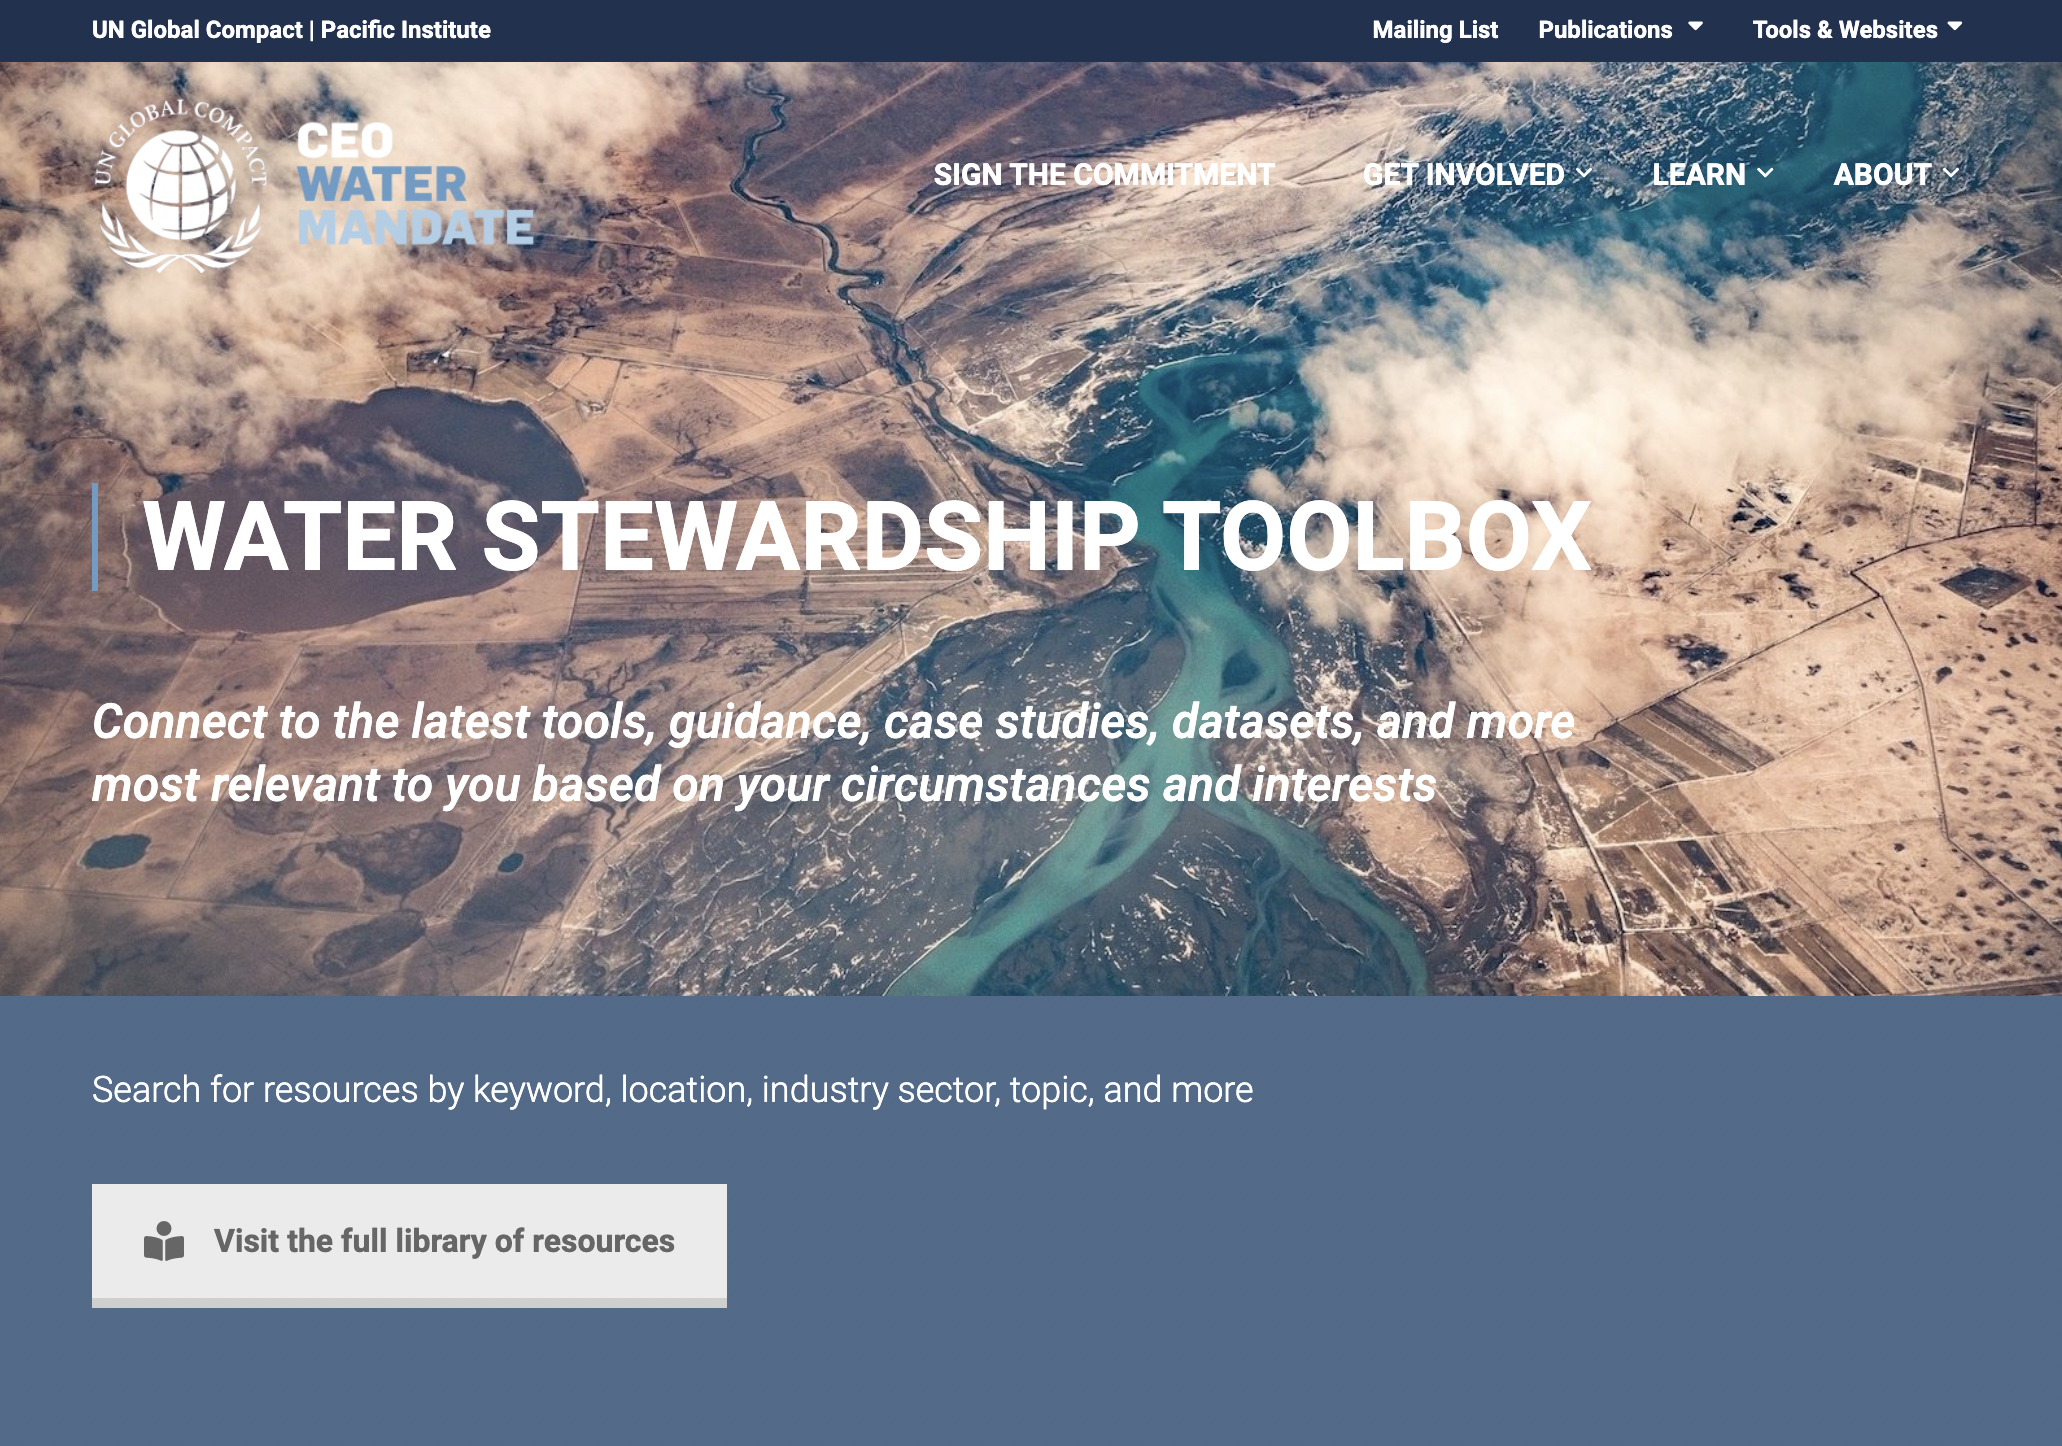
This toolbox connects businesses to the latest tools, guidance, case studies, datasets, and more. It features more than 250 resources from dozens of organizations and is updated every week.

This model helps evaluate the economic desirability of water conservation and efficiency measures and explore how costs and benefits can be shared among customers, water utilities, and other entities. The model helps document the costs of starting and running a conservation program and estimate the associated water, energy, and financial savings.
A CE2 Model training webinar is available here.
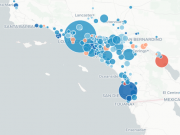
This interactive online map helps users decode the wealth of information on water use in California. The features allow users to examine how water use varies within regions, across the state, and over time. Colored zones show a gradient of water use across the state, from green for lower per capita water use to bright red for the highest users. By clicking on each location, users can see graphs of per capita use over time and comparisons to the regional and state averages.

This easy-to-use analytical tool can be used to evaluate the energy and greenhouse gas implications of water management decisions. The Excel-based model allows the user to explore a range of possible scenarios, such as increased demand for water resources, the development of alternative water and energy sources, and needed water treatment improvements resulting from emerging contaminants and stricter water-quality guidelines.

The free Urban Water Demand to 2100 model from the Pacific Institute helps water managers to forecast urban water demand with four global climate change models and compare different possible futures to the year 2100 by altering greenhouse gas emissions, population projections, conservation and efficiency measures, and more. This flexible modeling tool allows users to run their own scenarios, comparing how a range of factors in a range of climate change scenarios is likely to affect future patterns of water use in their specific areas. Click to download this tool.
This interactive online map shows the coastal flood and erosion hazard zones from the Pacific Institute study The Impacts of Sea-Level Rise on the California Coast. Users can display the location and attributes of health-care facilities, schools, fire and police stations, wastewater plants, and EPA-listed facilities that are vulnerable to coastal flooding.

This model aims to give water managers a better understanding of the relationship between water management decisions, energy consumption, and air quality. Designed for agricultural districts, the model provides a flexible, consistent framework for quantifying the energy and air quality dimensions of water management decisions. View the full-resolution user manual here.
This model aims to give water managers a better understanding of the relationship between water management decisions, energy consumption, and air quality. Designed for urban water districts, the model provides a flexible, consistent framework for quantifying the energy and air quality dimensions of water management decisions. View the full-resolution user manual here.