Wetland Migration Frontier
The areas depicted represent the land area inundated by the Mean Higher High Water (MHHW) tides in the year 2100 that is not inundated in the year 2000 by MHHW.
The dataset covers the California coast with the exception of the San Francisco Bay which is covered in the layers created by Noah Knowles of USGS/SCRIPPS. The link for San Francisco Bay inundation is: .
Extract from page 31-32 in main report:
Wetlands exist in areas that are frequently, but not permanently inundated. In The Effects of Sea Level Rise on US Coastal Wetlands, Park et al. (1989) assumed that all areas between mean lower water (MLW) and mean higher water springs (MHWS) are tidal wetlands (Figure 13). The MHWS is only a few centimeters from the mean higher high water (MHHW) datum, which is more readily calculated and tabulated in tide reports. We assume that wetlands will migrate to land areas that are below the future MHHW, which we estimate as current MHHW plus the projected 1.4 m sea-level rise.
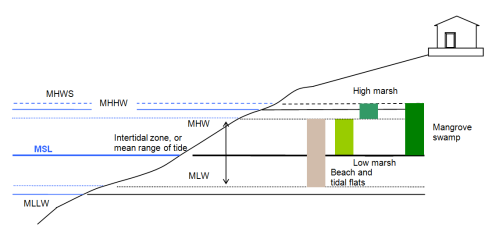
Figure 13: Assumed wetland area defined by the intertidal range. Adapted from Park et al. 1989.
The station locations and tide data for all NOAA operated tide stations is available from NOAA in non-spatial format from the website:
Wetlands exist in areas that are frequently, but not permanently inundated. In The Effects of Sea Level Rise on US Coastal Wetlands, Park et al. (1989) assumed that all areas between mean lower water (MLW) and mean higher water springs (MHWS) are tidal wetlands (see figure). The MHWS is only a few centimeters from the mean higher high water (MHHW) datum, which is more readily calculated and tabulated in tide reports. We assume that wetlands will migrate to land areas that are below the future MHHW, which we estimate as current MHHW plus the projected 1.4 m sea-level rise.
Table 6. Mean higher high water (MHHW) for long-term tide stations on Californias Pacific coast
| NOAA Station ID | Station Name | MHHW |
|---|
| 9410170 | San Diego, CA | 1.61 |
| 9410230 | La Jolla, CA | 1.57 |
| 9410660 | Los Angeles, CA | 1.61 |
| 9410840 | Santa Monica, CA | 1.60 |
| 9411340 | Santa Barbara, CA | 1.61 |
| 9412110 | Port San Luis, CA | 1.60 |
| 9413450 | Monterey, CA | 1.67 |
| 9414290 | San Francisco, CA | 1.80 |
| 9415020 | Point Reyes, CA | 1.75 |
| 9416841 | Arena Cove, CA | 1.76 |
| 9418767 | North Spit, CA | 1.99 |
| 9419750 | Crescent City, CA | 1.98 |
Note: Elevations in meters above NAVD88 vertical datum. Tide datums
calculated by NOAA for the 19832001 epoch.
Source: http://tidesandcurrents.noaa.gov/
The National Oceanic and Atmospheric Administration maintains tide stations along the California coast that provide measurements of MHHW. We interpolated the high-water elevation for the entire California Pacific coast using data from 12 long-term coastal tide gages. Each of these NOAA tide stations has been in continuous operation for over 25 years. The MHHW elevation for each of these stations is listed in Table 6. Using spatial interpolation tools available in ArcGIS software, we developed a continuous grid or surface of MHHW elevations in year 2000*. To estimate MHHW elevations with a 1.4 m sea-level rise for the Pacific coast of California, we created a second surface by adding 1.4 m to each pixel in the year 2000 MHHW surface. The difference between the high water lines is the wetland migration zone: the land into which wetlands must migrate to survive.
*In some areas of Southern California, however, the available digital terrain data were not sufficiently detailed to complete the analysis. The terrain data do not include points below an elevation of 1.5 m NAVD88, and we could not map the current MHHW inundation extent for the entire coast. We mapped about 49% of Santa Barbara County, 23% of Los Angeles County, and 65% of Orange County. The coverage was 100% in the other 11 counties on the Pacific coast.
Disclaimer:
This information is being made available for informational purposes only. Users of this information agree by their use to hold blameless the State of California, and its respective officers, employees, agents, contractors, and subcontractors for any liability associated with its use in any form. This work shall not be used to assess actual coastal hazards, insurance requirements, or property values and specifically shall not be used in lieu of Flood Insurance Studies and Flood Insurance Rate Maps issued by the Federal Emergency Management Agency (FEMA).
Created by the Pacific Institute, 2009.